What Is Website Analytics and How Does It Work?

So, what exactly is website analytics?
Think of it as the ultimate source of truth for your website. It’s the process of gathering all the raw data about how people behave on your site and then turning that data into a story you can actually understand and use. It tells you who your visitors are, how they got to your digital doorstep, and what they did once they arrived.
This isn't about staring at spreadsheets full of confusing numbers. It's about getting a clear, actionable map of your audience's journey, so you can stop guessing and start making smart decisions.
Your Guide to Understanding Website Visitors
Imagine for a second that you own a brick-and-mortar shop. Now, imagine trying to run it without knowing how many people walk in, which aisles they browse the most, or what items they look at before walking out empty-handed. You'd essentially be flying blind, right?
Website analytics prevents that from happening online. It’s your digital equivalent of a super-attentive store manager, tracking all that crucial activity to give you the intelligence you need to make your online storefront better.
This data breathes life into your audience, helping you answer the big questions that really matter for your business:
- Who is actually on my site? You can find out their general age, location, and even what kind of device they're using to browse.
- How did they even find me? Was it a random Google search, a link from your latest Instagram post, or did they type your URL directly?
- What are they clicking on? This shows you which pages are a huge hit and, just as importantly, where people seem to get stuck or just give up and leave.
By getting a handle on these patterns, you can start making real, informed changes to improve your website, fine-tune your marketing, and ultimately, grow your business. This isn't just a nice-to-have anymore; it's a core part of running a successful online store.
To give you a quick cheat sheet, here are the core concepts broken down into simple terms.
Key Concepts In Website Analytics At a Glance
Understanding these basic building blocks is the first step. From there, you can start connecting the dots to see the bigger picture.
A huge part of this is understanding the entire path a customer takes, from their first click to their final purchase. It's all about mastering your customer digital journey. When you know their path, you can smooth out any bumps and guide them right where you want them to go.
And this isn't some niche hobby, either. The proof is in the numbers. The global web analytics market is currently valued at around $7.54 billion and is expected to explode to $20.2 billion by 2029. That incredible growth is directly tied to the e-commerce boom, highlighting just how critical this data is for anyone trying to stay competitive. You can dig deeper into these trends in the full web analytics growth report from Research and Markets.
The Core Metrics That Actually Matter
Jumping into your website analytics for the first time can feel like trying to drink from a firehose. With all the charts, graphs, and numbers staring back at you, it's easy to get overwhelmed. But here’s a little secret from the trenches: you don't need to track everything.
To really get a grip on what's happening on your site, you only need to focus on a handful of key metrics. Think of them as your website's vital signs. Just like a doctor checks your heart rate and blood pressure for a quick health snapshot, these numbers cut through the noise and tell you what’s working and what needs a little TLC.
This graphic offers a great visual breakdown of the key performance indicators that should be front and center on your dashboard.
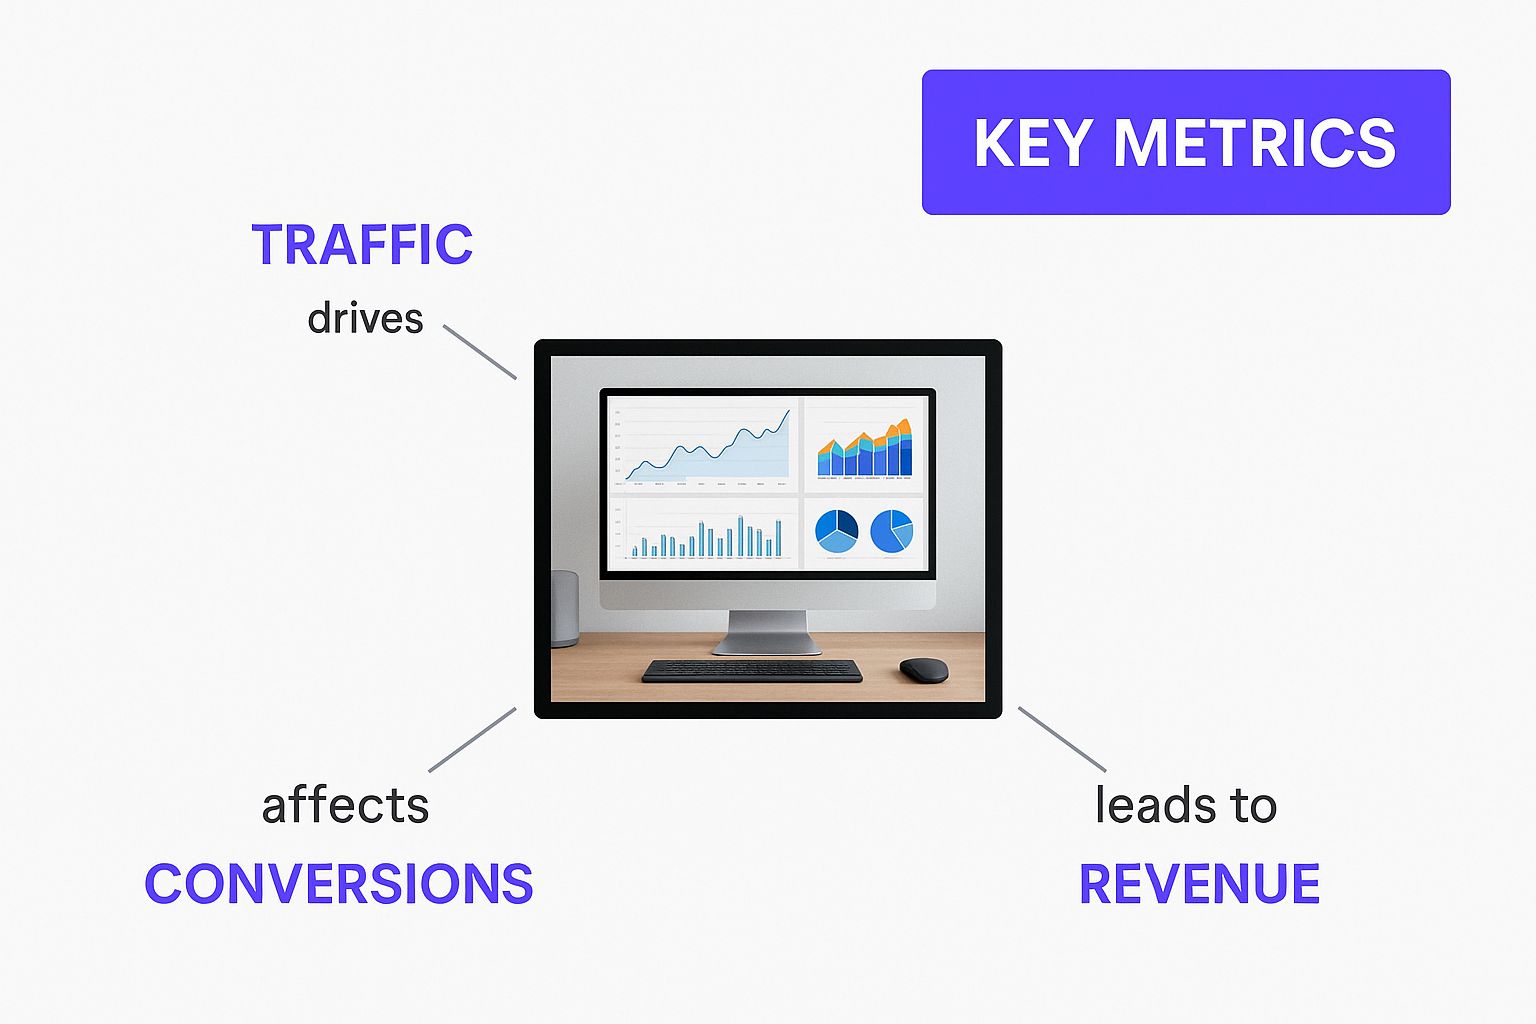
Seeing these metrics together really helps connect the dots between how people use your site and whether you're hitting your business goals.
The Most Important User Engagement Metrics
So, where do we start? Let's break down the essential metrics that reveal how visitors are actually interacting with your website. These are the numbers that tell a story about the user experience.
Sessions: This isn't just a simple visit. A session is a whole interaction, starting when someone lands on your site and ending after 30 minutes of them not doing anything. One person can have multiple sessions, and tracking this helps you gauge overall site traffic and engagement.
Bounce Rate: Picture someone walking into your shop, taking a quick glance, and immediately turning around and leaving. That's a bounce. A high bounce rate means people are leaving after viewing just one page, which is a big red flag that the page wasn't what they expected or was hard to use.
Average Session Duration: This one's pretty straightforward—it’s the average amount of time people stick around on your site. Longer sessions are generally a good sign. It means your content is interesting and people are finding what they came for.
The Metrics That Drive Business Growth
Beyond just keeping people engaged, you need to know if your website is actually helping your business grow. These next metrics are all about the bottom line. They show you if your site is doing its most important job: making you money.
At the end of the day, analytics isn't about collecting data for the sake of it. It's about finding real, actionable insights. Your conversion rate is the ultimate test of whether your website design, marketing, and products are all clicking into place.
To make truly informed decisions, you have to track the right data points. If you want to dig deeper into this, there's a fantastic guide on the 10 Key Website Metrics to Track for Growth that I highly recommend.
Here are the key business-focused metrics you can't ignore:
Conversion Rate: For any e-commerce site, this is the big one. It’s the percentage of visitors who do what you want them to do—whether that's making a purchase, signing up for your email list, or filling out a form. A higher conversion rate means you're getting more value from the traffic you already have.
Traffic Sources: Knowing where your visitors come from is golden. It tells you which of your marketing efforts are paying off. Is it organic search, social media, or your email newsletter? This data shows you exactly where to invest more time and money.
By keeping a close eye on these specific metrics, you can get a crystal-clear picture of your website's performance without drowning in a sea of data.
How Website Analytics Uncovers Insights
Ever wondered how your website seems to know so much about its visitors? It’s not magic, but it’s pretty close. The whole process kicks off the moment someone lands on your site, all thanks to a tiny piece of code you’ve added. This is often called a tracking code or a pixel, and it works like an invisible doorman, quietly taking notes in the background.
This little snippet of code is the real workhorse of website analytics. When a user’s browser loads one of your pages, it also fires up this code. From there, the code begins to gather anonymous bits of information about that visit—things like which page they landed on, whether they're on a phone or a desktop, and their general geographic location.

Often, this process uses cookies, which are small text files stored right in a user's browser. Think of a cookie like a digital ticket stub. When someone visits your site for the first time, the tracking code hands their browser a unique ticket. If they come back later, the code recognizes that stub and knows they're a returning visitor, not a brand-new face.
From Clicks to Clear Reports
So, how does all this raw data turn into a report you can actually use? Every piece of information collected by the tracking code is sent over to your analytics platform, like Google Analytics. This platform is the central command center, sorting through billions of data points and organizing them into something a human can make sense of.
It takes all that raw information and groups it into meaningful metrics. For instance, it bundles all the pageviews from a single visit into what’s called a session. It also figures out how visitors found you in the first place, sorting them into traffic sources like:
- Organic Search: People who found you through a search engine like Google.
- Direct Traffic: Folks who typed your website URL directly into their browser.
- Referral: Visitors who clicked a link on another website to get to yours.
- Social: Anyone who arrived from a social media platform like Facebook or Instagram.
This step is what turns a chaotic flood of clicks into structured, understandable information. The analytics tool then presents it all in easy-to-read dashboards full of charts and graphs.
The real power of website analytics isn’t just in collecting data but in its transformation. It turns millions of individual user actions into clear, actionable trends that tell the story of your website's performance.
Trusting the Data You See
Once you understand this journey—from a single click to a finished report—you can really start to trust the insights you’re getting. It’s not a black box; it's a logical system built to give you a clear, honest picture of how people interact with your site.
Think of it like having a super-helpful librarian for your online store. Instead of just checking out books, this librarian also notes which aisles are the busiest, which products people look at but don’t buy, and how long they stick around. That’s exactly what your analytics platform does for your website. By seeing how it all works, you can feel confident using this data to make your store better and guide visitors right to what they’re looking for.
Choosing the Right Web Analytics Tool
So, you've figured out what you need to track. The next big step is picking the right tool for the job. Think of choosing a web analytics platform like hiring a key team member—you need someone reliable who gives you clear insights and can scale with your business as you grow.
The sheer number of options out there can feel a bit much at first. But don't get bogged down in endless feature lists. Your decision really just boils down to your specific goals, how comfortable you are with tech, and, of course, your budget. Are you just starting out and need something powerful and free, or are you looking for a tool that’s simpler to use or puts customer privacy first?
The Big One: Google Analytics
For most e-commerce shops just getting started with analytics, the conversation usually starts and ends with Google Analytics. There's a good reason it's the most popular platform on the planet: it’s incredibly powerful, plugs into just about everything, and it’s completely free. It offers a massive amount of data, capable of answering almost any question you could possibly have about your visitors.
Here’s a peek at a standard Google Analytics dashboard, which gives you a bird's-eye view of what’s happening on your site.
Right away, you can spot trends in user sessions, see how many people are leaving right away (your bounce rate), and find out where your traffic is coming from. It’s a perfect daily health check for your online store.
While all its features can seem a little intimidating when you first log in, its reports are smartly organized around the customer journey. This makes it much easier to find the information you need, whether you're looking at how you attract customers, how they engage with your site, or how you keep them coming back.
A tool like Google Analytics really shines by taking millions of individual data points and weaving them into a story about your business. It shows you exactly which of your marketing efforts are actually paying off.
What Else is Out There? Exploring Alternatives
Google Analytics may be the giant in the room, but it's far from the only option. In fact, a growing number of fantastic alternatives are popping up, each catering to different needs like enhanced privacy or a more straightforward user experience.
Privacy-First Tools: Platforms like Fathom or Plausible Analytics were built from the ground up with privacy in mind. They give you the essential insights you need without using cookies or collecting personal data, which is a huge plus for GDPR compliance and building trust with your audience.
Super User-Friendly Tools: Some tools, like the analytics suite inside HubSpot, focus on making data easy to understand for everyone. They are often built into a larger marketing platform, which means you can seamlessly connect your analytics to your CRM and email campaigns.
The market for these tools is absolutely booming. It was valued at $6.67 billion and is expected to reach a staggering $24.79 billion by 2033. This explosion is largely driven by small and medium-sized businesses that can now access powerful, cloud-based tools without needing an entire team of developers to run them. If you're curious about the numbers behind this growth, you can dive deeper into this web analytics market report.
Comparing Popular Web Analytics Tools
To help you navigate your options, here’s a side-by-side look at some of the leading web analytics platforms. This table focuses on what they're best for, their standout features, and how they handle pricing, giving you a clearer picture of which one might be the right fit for your business.
Ultimately, the "best" tool is the one that gives you the answers you need in a way you can understand and act on. Whether you stick with the industry standard or opt for a niche alternative, the goal is the same: to better understand your customers and build a more successful online store.
Turning Analytics into E-Commerce Wins

Okay, so you've got the basics of what website analytics is. Now for the fun part: putting that knowledge to work. Data is just a bunch of numbers until you use it to make real, profitable changes to your online store. It’s all about turning those charts and graphs into actual cash in the bank.
Let's walk through a real-world scenario. Imagine you spot a sky-high bounce rate on one of your key product pages. Instead of just shrugging it off, you dig in. The data shows that most of the people leaving are on their phones. A little more digging reveals the culprit: the "Add to Cart" button is a pain to tap on a small screen.
You ask your developer for a simple design fix. A week later, you check your analytics again. The bounce rate for that page has plummeted by 30%, and sales for that specific product are up 20%. That’s it. That’s the magic—turning a simple observation into a data-backed solution.
Uncovering Your Most Profitable Channels
One of the first things you should do with your analytics is figure out where your best customers are coming from. Your dashboard will show you a breakdown of traffic sources—organic search, social media, paid ads, you name it. But don't stop there. The real insight comes from connecting those sources to actual sales.
For instance, you might see that Instagram is sending you thousands of visitors, which feels great! But when you look closer, you see very few of them actually buy anything. At the same time, your little email newsletter only brings in a few hundred people, but they convert like crazy.
This is a huge "aha!" moment. It tells you exactly where to put your time and money. You can double down on your email marketing and start rethinking your Instagram strategy to attract people who are ready to buy, not just browse.
This isn't just a hunch; it's a global trend. Businesses everywhere are using analytics to get smarter with their marketing. Fueled by the e-commerce explosion, the Asia Pacific web analytics market alone is expected to reach an incredible $6.34 billion by 2033. You can read more about this growth in this detailed web analytics market analysis.
Actionable Strategies for E-Commerce Growth
Beyond the big-picture stuff, you can use analytics for tactical, everyday improvements across your store. Here are a few practical ideas to get you started:
Optimize Your Product Pages: Look at metrics like Average Time on Page and Exit Rate to find pages that are turning customers away. Are people leaving almost immediately? Maybe your product descriptions are confusing, the photos are blurry, or the price isn't what they expected.
Slash Cart Abandonment: Set up a conversion funnel in your analytics tool to watch how people move through your checkout. If you see a massive drop-off on the page where you ask for shipping info, you've found a problem. Maybe your shipping costs are too high, or the form is just too complicated to fill out.
Personalize the Shopping Experience: Analytics can show you which products your customers often look at together. Use this goldmine of data to create "You might also like..." sections or build product bundles that naturally increase your average order value.
By constantly asking "why?" and testing your hunches, you graduate from simply knowing what is website analytics to using it as a true growth engine. Every single metric tells a piece of your customer's story. Your job is to listen closely and use that story to make your store a little bit better, every single day.
Common Questions About Website Analytics
Jumping into website analytics can feel a lot like trying to learn a new language. It's totally normal to have a ton of questions swirling around. The best way forward is to get simple, straight answers so you can build your confidence and start putting that data to good use.
Think of this as a friendly FAQ session to clear up the confusion. The goal isn't to make you a data scientist overnight. It's to get you comfortable enough to start asking the right questions about your own business and know where to look for the answers.
How Long Until I See Results From Analytics?
You'll start seeing data show up in your analytics tool almost right away, but finding trends you can actually trust takes a little more patience.
As a rule of thumb, give it at least 30 to 90 days to establish a solid baseline. That window of time is usually enough to see past the random daily fluctuations and get a real feel for what "normal" traffic and behavior look like on your site.
But the real "results" don't just pop out of the data. They come from taking action. It's a simple loop:
- Analyze: Find a pattern or a problem (e.g., "Lots of people are abandoning their carts on the shipping page").
- Act: Make a change on your site to fix it (e.g., "Let's simplify the shipping options").
- Measure: Check back to see if your change actually worked.
This cycle of testing, learning, and refining is where you unlock the true power of your analytics.
Is Website Analytics The Same As SEO?
Nope, but they're best friends who work together perfectly.
Think of it like this:
- SEO (Search Engine Optimization) is everything you do to get people from search engines like Google to visit your website. It’s all about getting them to your digital doorstep.
- Website Analytics tells you what those people do once they arrive. It shows you how effective your SEO is—and everything else on your site, for that matter.
For instance, your analytics will tell you which keywords are bringing in real traffic, which pages those search visitors love the most, and whether they're actually buying anything. SEO brings you the audience; analytics tells you if you've brought the right audience.
Website analytics is the report card for your SEO strategy. It proves that your hard work is doing more than just driving clicks—it's driving real business growth.
Do I Need To Be A Data Scientist To Use Analytics?
Not at all. Modern analytics tools are built for business owners and marketers, not statisticians. The most important skill you need is curiosity about your own business. You don't have to wrestle with crazy algorithms; you just need to know how to ask good questions.
Start simple. Ask things like, "Where are my best customers coming from?" or "Why do so many people leave this one product page?" The tools are designed to give you answers with clear, visual reports. Stick to the main dashboards at first, and you can explore the more advanced stuff as you get more comfortable. If you're looking for a deeper dive, you can find a great overview in this guide on Web Analytics.
How Does User Privacy Affect Web Analytics?
This is a huge topic right now. User privacy regulations like GDPR and browser changes that block cookies have really shaken up how data is collected. This has pushed the industry toward more privacy-friendly analytics.
Many modern platforms now offer "cookieless" tracking or focus on collecting anonymous, big-picture data. This means you can still get valuable insights—like which pages are most popular or where your traffic comes from—without tracking individual users. When you're picking a tool, make sure it's one that's upfront about its data practices and helps you stay compliant.
At Wand Websites, we don't just build beautiful stores; we build smart ones. We integrate powerful analytics from day one, giving you the insights to turn your hard work into more traffic, bigger orders, and loyal customers. Let us handle the technical setup so you can focus on growth. https://www.wandwebsites.com
