What Is Website Analysis? Your Complete Guide to Success


Understanding Website Analysis: Your Digital Detective Story
Imagine your website is a physical store you’ve carefully crafted. The layout is planned, the products are displayed, and the doors are open. Now, picture being able to see exactly what every customer does: which aisles they walk down, what items they pick up, and where they get stuck before leaving. This is the essence of website analysis. It’s the practice of gathering and studying data to understand precisely how visitors behave on your site.
Instead of guessing why sales are slow or why your contact form isn't getting submissions, website analysis gives you solid clues. It helps you move from hunches to informed decisions backed by real user data. This isn't a complex process reserved for huge companies; it's a vital tool for any business looking to succeed online, from local service providers to global e-commerce stores.
Why It's More Than Just Numbers
At its heart, website analysis is about understanding people. Every click, scroll, and form submission tells a part of a story about your audience—what they want, what confuses them, and what encourages them to take action. For instance, you might see that a product page gets a lot of traffic, but very few visitors click the "buy now" button. This insight is a call to investigate further. Is the button hard to see? Is the price not clear? Is some key information missing?
By examining the data, you can spot these kinds of patterns that would otherwise remain invisible. This approach is so crucial that by 2025, it's projected that 55.49% of all websites—nearly 38 million in total—will use analytics tools to translate digital activity into clear actions. You can dig deeper into these figures and their business implications by reviewing the latest analytics statistics.
From Guesswork to Growth
Without analysis, changing your website is like rearranging your store with a blindfold on. With it, every adjustment is a calculated step toward better performance. The main objective is to turn raw data into a clear story that shapes your strategy. This methodical process helps you:
- Find out which marketing efforts deliver the most valuable visitors.
- See which pages capture visitor interest and which ones cause them to leave.
- Identify and fix issues in the checkout process that are costing you sales.
- Discover what kind of content truly connects with your audience.
Ultimately, knowing what website analysis is means you can stop guessing and start knowing. It transforms your website from a static brochure into a dynamic and reliable tool for business growth.
Essential Metrics That Actually Matter for Your Business
When you dive into website analysis, you'll encounter a sea of numbers. Some are like fool’s gold—shiny but ultimately worthless. These are often called vanity metrics, like total page views. They might look impressive on a report, but they don't tell you if your business is actually growing. The goal is to focus on metrics that directly reflect your business's health and your customers' happiness.
Think of it like checking your car's dashboard during a road trip. The radio volume is a metric, sure, but it's the fuel gauge and engine temperature that tell you if you'll actually reach your destination. In website analysis, you need to watch the gauges that matter. For an e-commerce store, the crucial question isn't just how many people visit, but how many make a purchase. This is how we separate distracting noise from actionable signals.
Signals for Real Growth
True performance metrics are tied directly to your goals. They tell a story about how users are interacting with your site in ways that benefit your business. For an online store aiming to increase sales, the most important metrics are usually related to conversions and how people engage with your content.
Here are a few of the most important ones:
- Conversion Rate: This is the percentage of visitors who complete a goal, like buying a product or signing up for a newsletter. It’s the ultimate report card on your website's effectiveness.
- Average Order Value (AOV): This metric reveals the average amount of money a customer spends in a single transaction. Increasing your AOV is a great way to boost revenue without needing more traffic.
- Bounce Rate: This is the percentage of visitors who land on a page and leave without clicking anywhere else. A high bounce rate can be a warning sign that your page content doesn't meet their expectations or that the user experience is frustrating.
- Time on Page: This measures how long visitors stay on a specific page. Generally, a longer duration suggests your content is relevant and holds their attention.
These numbers give you an honest picture of what’s really happening. For example, if a product page gets lots of traffic but has a low conversion rate, that’s a major red flag. It tells you to investigate that specific page for issues with pricing, product descriptions, or even the "Add to Cart" button. By focusing on these core indicators, you can make informed changes that lead to measurable improvements—a core principle we champion at Wand Websites when building growth-focused e-commerce stores.
To help you understand these metrics more clearly, the table below breaks down what they measure and why they are so vital for your business decisions.
Ultimately, this table serves as a cheat sheet for translating numbers into a narrative about your website. These metrics don't just exist in a vacuum; they point you toward specific actions you can take. By monitoring these key indicators, you move from simply collecting data to making strategic improvements that drive real business growth.
The Complete Analysis Process: From Chaos to Clarity
Turning a mountain of raw website data into a clear action plan can feel like an impossible task. However, a structured process can bring order to the chaos. Think of website analysis not as a one-time project, but as a continuous cycle of learning and improving. It's similar to a chef perfecting a recipe; they don't just taste the final dish. They taste, adjust, and taste again, making small, informed changes until it's just right. This systematic approach transforms confusing numbers into a clear story about your website’s performance.
Step 1: Define Your Goals and Benchmarks
Before you look at a single metric, you must first define what success looks like for your website. What is its main purpose? Is it to sell products, generate leads for your sales team, or simply inform visitors? Your specific goals will determine which metrics are most important. For an e-commerce store, a primary goal is almost always a higher conversion rate. For a content-focused blog, it might be an increase in time on page.
Once your goals are clear, you need to establish benchmarks. These are your starting points—the current performance levels you want to improve upon. For instance, if your current conversion rate is 2%, an initial goal might be to boost it to 3% over the next quarter. This provides a concrete target to measure your progress against.
Step 2: Gather and Segment Your Data
With your goals in hand, you can begin collecting the right data from your analytics tools. This isn't about grabbing every number available; it's about gathering the specific metrics tied to your objectives. If your goal is to understand user engagement, you’ll focus on data points like bounce rate, session duration, and pages per session.
A critical part of this stage is segmentation. Instead of viewing all your visitors as one big, faceless group, you divide them into smaller, more insightful segments. You could compare:
- New visitors vs. returning visitors
- Traffic from social media vs. traffic from search engines
- Mobile users vs. desktop users
This process often uncovers powerful insights. You might find that mobile users have a significantly higher bounce rate, which could signal a problem with your site's mobile design that requires immediate attention.
Step 3: Analyze, Hypothesize, and Test
With your segmented data ready, the real analysis begins. The key here is to constantly ask "why?" Why is the bounce rate so high on a particular landing page? Why do visitors from Instagram convert at a higher rate than those from Facebook? This is the point where raw data starts to become actionable insight.
The following infographic shows this simple but effective cycle of analysis.
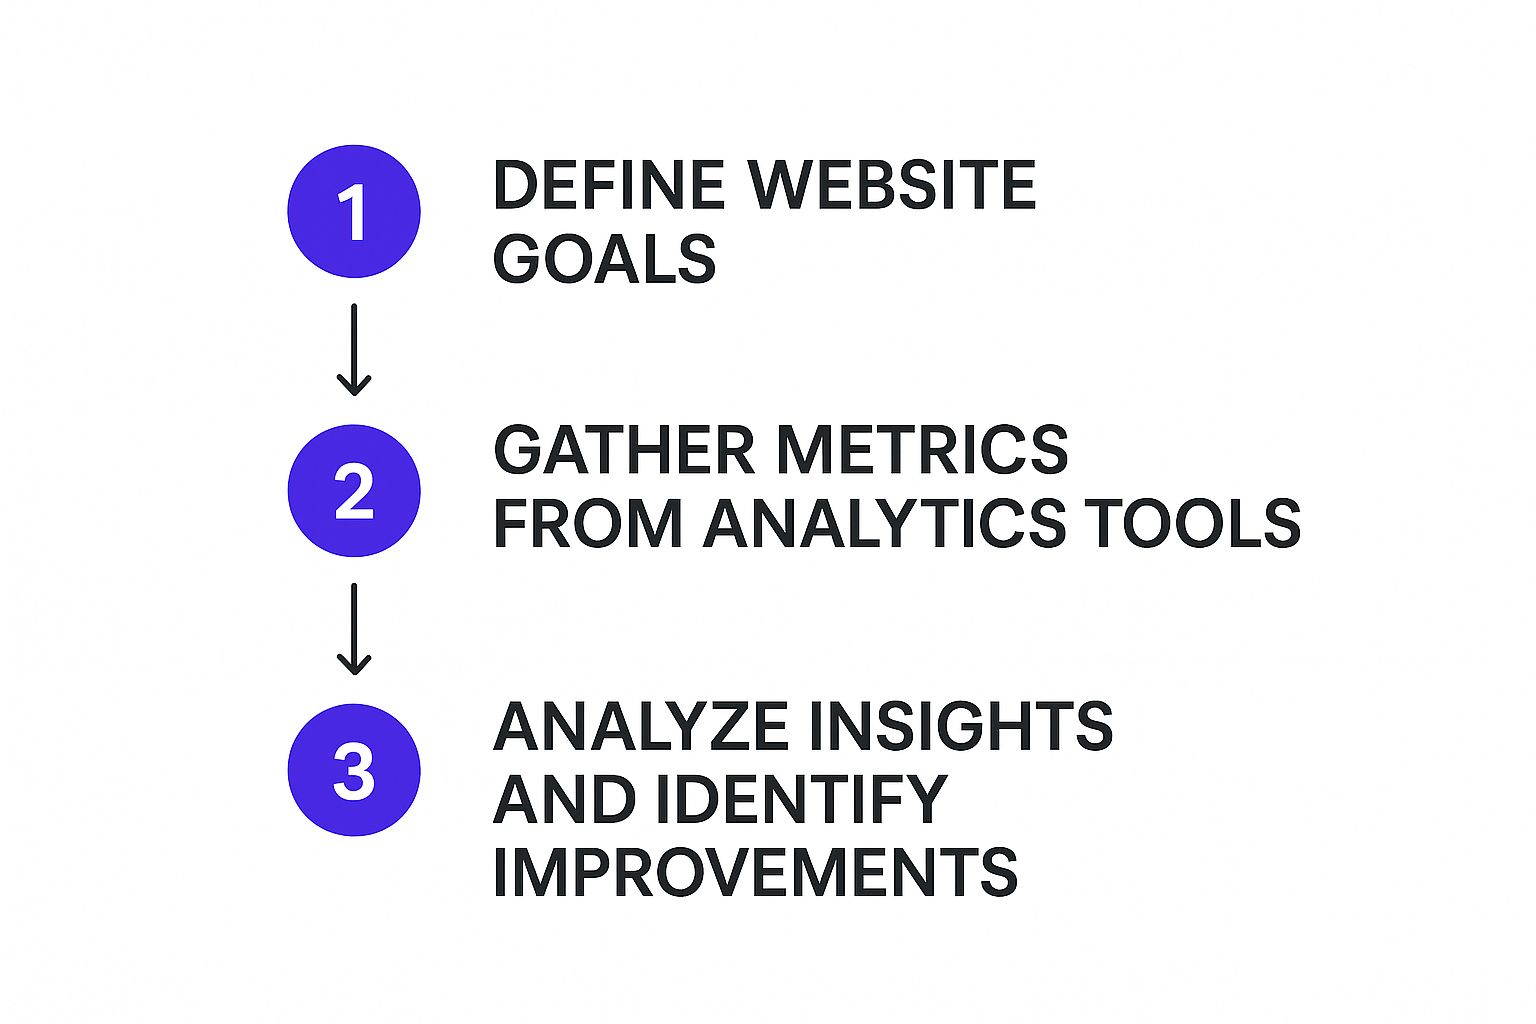
This visual shows that website analysis is a loop, not a straight line. The insights you gain from one test will fuel your next hypothesis. Based on what you find, you can form a hypothesis (for example, "Changing the 'Buy Now' button color from blue to orange will increase clicks") and then run an A/B test to see if you're right. This completes the cycle, giving you fresh data to benchmark against for ongoing improvement.
Choosing the Right Tools for Your Analysis Arsenal

Picking the right tools for your website analysis can feel like a huge task. The key isn't to find one perfect tool that does everything, but to assemble a set of tools that work together. Think of it like a mechanic's toolbox; you need more than just a single wrench to do the job right. Your business will benefit most from a mix of platforms, each giving you a different perspective on your website's performance.
The foundation of any good toolkit is a general analytics platform. These tools answer the fundamental "what" questions: What pages are visitors looking at? Where did they come from? How long did they stay? But they often stop short of explaining the "why" behind those actions. That's where more specialized tools come into play.
Building a Well-Rounded Toolkit
To see the whole story, it's best to layer different types of tools. Imagine an e-commerce store using its main analytics platform and noticing that many shoppers are leaving the site from the checkout page. The data tells them what is happening, but not why.
This is the perfect time to bring in a behavior analytics tool. This type of tool can offer features like:
- Heatmaps: These are visual guides that show you exactly where users click, move their mouse, and how far they scroll down a page.
- Session Recordings: You can watch anonymous recordings of real user visits to see how people navigate your site, where they get confused, and what might be causing them to leave.
By combining these tools, you move from simply knowing a problem exists to seeing the exact point of friction. You might discover that a confusing form field or a non-working button is the real reason for those lost sales.
Comparing Your Options
To help you decide which tools are right for you, we've put together a comparison of some popular options. This table breaks down their best uses, key features, and general costs.
This table shows how different tools serve distinct purposes. A powerful, free tool like Google Analytics is a fantastic starting point, but pairing it with a visual tool like Hotjar can provide much deeper insights into why users behave the way they do.
Many businesses find success by mixing powerful, free platforms with specialized, low-cost options. This creates a custom system that fits their specific needs without a huge investment. For instance, some platforms are excellent at providing detailed SEO insights, which helps you understand how your site appears in search results. You can find more on this in HubSpot’s guides on analyzing content performance.
The best approach is to start with a solid foundation and add new tools only when you have a specific question your current setup can't answer. This strategy keeps you from getting overwhelmed by data and ensures every tool in your arsenal has a clear purpose.
When Data Meets Human Behavior: The User Experience Revolution
Behind every metric—every click, scroll, and bounce rate—is a real person trying to solve a problem or find an answer. While charts and graphs are great at showing you what is happening on your website, the real magic of website analysis happens when you start to understand why. This is the point where data analysis transforms into a study of human behavior, turning cold numbers into a story about your visitors' journeys, their frustrations, and what truly motivates them. It’s like being a detective, using clues from data to understand the people behind the screens.
Great websites don't just happen; they are carefully refined to create an experience that feels natural and helpful. They use analysis to find "friction points" in the user journey and smooth them out. For example, a high bounce rate on a product page isn't just a number to report. It’s a clear signal that visitors arrived expecting one thing and found another. Was the ad that brought them there misleading? Does the page take too long to load? Is the layout confusing? Answering these questions is the core of improving the user experience (UX).
From Numbers to Empathy
This way of thinking requires a mental shift from staring at spreadsheets to picturing a person navigating your site. The numbers are your map, but empathy is your true north. This approach is backed by some fascinating psychological findings. For instance, it takes only 0.5 seconds for a visitor to form an opinion about your website, and a staggering 94% of that first impression is based entirely on visual design. You can explore more statistics on user behavior to see just how much design influences perception. These split-second judgments show why a seamless experience is so important from the moment someone lands on your page.
When you start to understand these human tendencies, you can use your analysis to make smart changes. Take a look at this snapshot from Google Analytics, which shows how different traffic sources affect user engagement.
This dashboard tells a story. Organic search brings in the most users, but direct traffic leads to the most engaged visitors (they stick around longer and have a lower bounce rate). From this, we can form a hypothesis: people who already know our brand (direct traffic) have a better time on our site. The next logical step is to figure out how to give that same great experience to new visitors arriving from search engines. This is how you turn data-driven empathy into real business growth, converting first-time visitors into dedicated customers.
Transforming Analysis Into Measurable Business Growth
The real value of website analysis shines through when abstract data points are turned into concrete business actions. This is the moment you stop just collecting interesting numbers and start making strategic decisions that directly affect your bottom line. Every success story is built on this very transition.
Picture an online store noticing a significant number of customers abandoning their carts at the same step. By looking at session recordings, they discover a confusing shipping form is the culprit. A simple redesign of this form could lead to a 25% increase in completed purchases, providing a direct boost to revenue.
This is how analysis helps a business shift from being reactive to proactive. Instead of guessing why sales have dipped, you know exactly where the problem lies. This data-driven approach allows you to connect every website change to its financial result, clearly showing the return on investment (ROI) from your efforts.
From Insights to Impact
To link analysis with growth, you need a clear way to communicate its value. When presenting your findings to team members or stakeholders, simply sharing metrics like bounce rates isn't enough. You have to translate that data into a compelling business story.
For instance, instead of saying, “The bounce rate on our new landing page is 70%,” you can frame it as, “We are potentially losing 7 out of every 10 leads from our latest campaign because of issues on the landing page. This could mean $15,000 in missed opportunities this quarter.” This reframing makes the issue urgent and highlights the financial importance of your findings.
The growing awareness of this direct link between analysis and profit is why the web analytics market is expanding so quickly. In 2024, the market was valued at around $7.54 billion, and it's expected to reach $8.89 billion by 2025. This impressive growth shows that analysis is no longer seen as just a technical chore but as a core business function. You can read the full research on the web analytics market to see the full picture.
Ultimately, the goal is to build a culture where data informs confident decisions. When teams across your company understand how analysis uncovers opportunities and validates strategies, you move beyond guesswork. Your website evolves from a digital brochure into a predictable engine for business growth, much like the high-performing sites we create for our clients at Wand Websites.
Your Roadmap to Analysis Success: Taking Action Today
Understanding what website analysis is provides a serious edge, but the real magic happens when you put that knowledge into practice. The path from data to decisions doesn't call for a huge budget or a team of data scientists; it starts with a simple commitment to a structured process. Think of it as creating a new, healthy habit for your business. You begin small, stay consistent, and build momentum. The goal is to establish a repeatable system that grows with you, making sure your website remains your best tool for growth.
Setting Realistic Goals and Priorities
The first stop on your roadmap is to define what success means for you right now. Trying to analyze everything at once is a recipe for feeling overwhelmed. Instead, concentrate on one main business objective. Do you want to increase sales, generate more leads, or grow your email list? Let this single goal steer your first efforts. For instance, if generating more leads is your priority, you should focus your analysis on pages related to your contact forms or newsletter sign-ups.
With your focus clear, set a specific and achievable goal. A good starting point might be: “Increase form submissions by 10% in the next 60 days.” This target is clear, measurable, and has a deadline, which gives you a solid benchmark. By starting with a narrow scope, you can learn the ropes of analysis on a smaller scale, build confidence, and get some early wins that show the value of your work.
Building a Sustainable Analysis Routine
When it comes to analysis, consistency beats intensity. You don’t need to spend hours buried in analytics every day. A better approach is to weave analysis into your regular operations with a simple, repeatable schedule. Here’s a practical routine to get started:
- Weekly Check-in (30 minutes): Set aside a short block of time each week to look over your main metrics. Check for any big shifts or surprising trends related to your primary goal. Is your traffic up? Did your conversion rate take a dip? This quick look keeps you in tune with your site’s performance without being a major time drain.
- Monthly Deep Dive (2-3 hours): Once a month, go further. Dig into your data more thoroughly, review progress toward your goal, and come up with new ideas to test. This is your chance to watch session recordings or look at heatmaps to understand the "why" behind the numbers.
- Quarterly Strategy Review (Half-day): Every three months, take a step back and look at your overall strategy. Did you hit your goal? What did you learn along the way? Use these insights to set a new, informed goal for the next quarter. This cycle of analysis, action, and review creates a strong feedback loop for ongoing improvement.
This structured method turns website analysis from a big, scary task into a manageable and highly effective business practice. Ready to stop guessing and start growing with a website built for results? At Wand Websites, we partner with e-commerce businesses to turn data into profit.
