How to Measure ROI A Guide for Real Results

So, you want to know how to measure your Return on Investment, or ROI. At its core, the math is pretty straightforward: you take the profit an investment made, subtract what it cost you, and then divide that by the original cost. But let's be real—it's more than just a formula. Think of ROI as the ultimate truth-teller for your business decisions. It’s the compass that points you toward what’s actually working.
What ROI Actually Tells You About Your Business

Before we get buried in spreadsheets, let's zoom out and appreciate what this number really means. ROI isn't just a dry percentage; it’s the clearest way to judge how efficiently your money is working. Whether you're pouring cash into a new ad campaign or investing in inventory, ROI cuts through the fluff.
It answers the one question that truly matters: Was this worth it?
The Core ROI Formula at a Glance
To make sure we're all on the same page, let's break down the classic ROI formula into its essential parts. This simple table will be your go-to reference.
This simple math is the foundation for everything that follows. Keep these components in mind as we dive deeper.
Why You Absolutely Cannot Ignore ROI
Honestly, trying to grow an e-commerce business without tracking ROI is like trying to navigate a ship in a storm with no compass. You’re just guessing. You might feel like that new TikTok campaign is a hit, but the numbers will tell you the real story.
Getting a solid handle on your ROI lets you:
- Justify Your Marketing Budget: No more vague conversations with your boss or partners. You can walk in with hard data showing exactly which campaigns are making money.
- Spend Smarter, Not Harder: It’s a game-changer. You can confidently double down on what works and ruthlessly cut what doesn't.
- Spot Winning Opportunities: Thinking of launching a new product or testing a new ad platform? ROI is how you evaluate if it's a smart bet.
- See How You Stack Up: Compare the results of different campaigns against each other to see which strategies are truly the most effective.
It's what separates being busy from being profitable. ROI shifts your mindset from treating marketing as just another expense to seeing it as a strategic investment in your growth.
Investors have used this logic for decades. For instance, if you look at the stock market, the average historical return has hovered around 10% per year—a figure that serves as a common benchmark. You can dig into the data on historical investment returns from NYU Stern to see for yourself. We apply the same principle to our marketing efforts, measuring our success against clear financial goals. This foundation is key as we move into the practical steps of measuring what truly moves the needle.
Putting the ROI Formula into Practice
Theory is one thing, but let's get our hands dirty with some actual numbers. The best way to really get a feel for measuring ROI is to walk through a scenario you've probably faced yourself: running a paid ad campaign for your store.
Let's say you run an online shop that sells handcrafted leather goods. You decide to fire up a Google Ads campaign to get some eyeballs on a new line of wallets. Now, we'll see how that simple formula we talked about holds up in the real world.
A Google Ads Campaign Example
Your campaign runs for a full month. When it wraps up, you pop into your Shopify dashboard and see the ads brought in a cool $7,500 in direct revenue. That’s your "Return," or the gain you got from your investment. Easy enough.
But now for the tricky part: figuring out the "Cost of Investment." This is exactly where I see a lot of business owners trip up. They only count the ad spend.
Uncovering the True Cost of Investment
Your total investment is almost always more than just the cash you handed over to Google or Meta. If you want a truly accurate ROI, you have to be brutally honest about every single expense that went into making that campaign a reality.
For our leather goods shop, the real costs start to stack up:
- Direct Ad Spend: You spent $1,500 on the Google Ads platform itself.
- Creative Costs: You hired a freelance photographer for some pro shots of the new wallets. That was another $400.
- Software Fees: To make the campaign pop, you used a special landing page builder with a $50 monthly subscription.
- Team Time: Your marketing assistant spent about 10 hours setting up, managing, and tweaking the campaign. If their time is worth $30/hour, that's $300 in labor costs.
The little costs add up. Forgetting to include expenses like software, freelance help, or even your own time can artificially inflate your ROI, giving you a dangerously inaccurate picture of your campaign's performance.
So, when we add it all up, the true cost isn't just the $1,500 in ad spend.
Total Investment = $1,500 (Ads) + $400 (Photos) + $50 (Software) + $300 (Time) = $2,250
This is the number we need for a real calculation. Applying the general ROI formula correctly means understanding its nuances in different contexts; for a deeper dive, you can learn more about how to calculate marketing ROI.
Calculating the Final ROI
Alright, now we have all the pieces of the puzzle. We can finally plug our real-world numbers into the formula:
ROI = (Net Profit / Cost of Investment) x 100
First thing's first, let's nail down the Net Profit.
Net Profit = Revenue - Cost of Investment
$7,500 - $2,250 = $5,250
With that, we can finish our ROI calculation.
ROI = ($5,250 / $2,250) x 100 = 233%
What does this actually mean? For every $1 you put into this campaign, you got that dollar back plus an extra $2.33 in pure profit. Now that is a number you can build a business on. It’s a clear, powerful metric telling you this campaign was a huge success and is probably a prime candidate for a bigger budget next month.
Finding the Right Data for Your Calculation
Any ROI calculation is only as good as the numbers you plug into it. If you're just guessing, you're going to get a misleading result. So, the first real step is knowing exactly where to pull accurate figures. This isn't about getting lost in a sea of dashboards; it's about being surgical—knowing which numbers to grab and where to find them.
Nailing Down Your Revenue
Thankfully, your revenue data is usually the easiest piece of the puzzle to find. It lives right where the money comes in. For anyone running an e-commerce store, that means heading straight to your sales platform.
- Shopify: Your main analytics dashboard is the place to go. You can filter for total sales from a specific campaign or time period.
- Stripe or PayPal: These payment processors have fantastic reporting features that break down every single transaction.
- WooCommerce: Your WordPress dashboard has built-in sales reporting that will give you what you need.
This infographic breaks down how all the pieces come together for your final calculation.
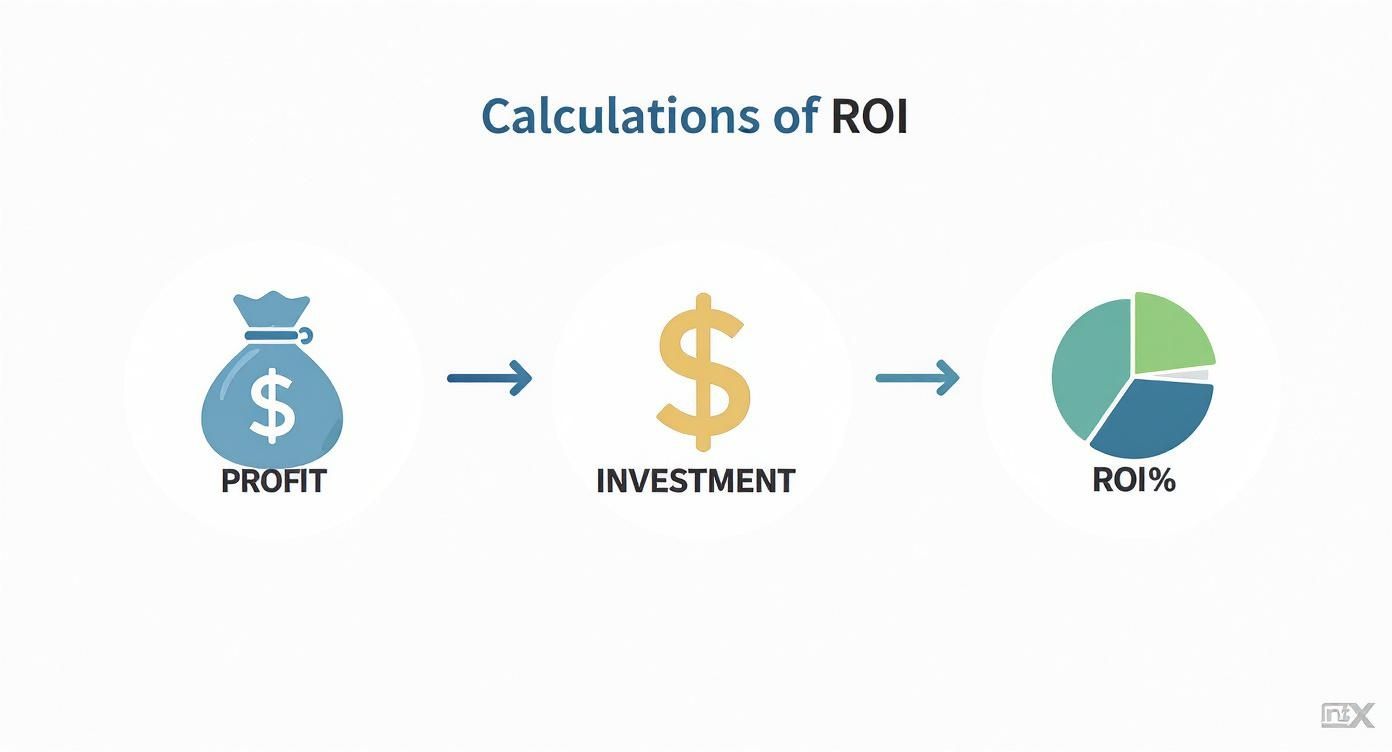
It’s a great visual of how profit and investment figures are combined to give you that clear, actionable ROI percentage.
Tracking Down Your Total Investment
Next up, we need to hunt down your costs. This data can be a little more scattered. The most obvious number is your direct ad spend, which you’ll find right inside platforms like Google Ads or Meta Business Suite. But that’s just one part of the story.
You also have to account for the "soft costs"—those resources that don't come with a neat invoice. I'm talking about your team's time spent managing a campaign, the monthly fee for your design software, or the cost of hiring a freelance copywriter. A simple spreadsheet or a project management tool is perfect for tracking these hours and their associated costs.
The single biggest mistake I see people make when calculating ROI is underestimating the true cost of an investment. Forgetting to factor in team hours, software fees, or one-off freelance costs will artificially inflate your ROI and give you a false sense of victory.
To make sure your data is truly accurate, you have to connect specific sales to the specific marketing efforts that drove them. This is where tracking becomes your best friend.
Attributing Sales with Precision
How do you really know that a sale came from your email campaign and not from someone just Googling your brand? You use attribution.
UTM parameters are a surprisingly simple but incredibly powerful way to tag your marketing links. Think of them as little breadcrumbs. When a customer clicks a link you've tagged with a UTM code, that information gets passed directly into your analytics platform.
This lets you see exactly which channels are pulling their weight. In Google Analytics, you can set up conversion goals to track which traffic sources are driving the most valuable actions on your site. This allows you to attribute revenue directly to the campaigns that earned it, making your ROI calculation something you can actually trust.
Going Beyond the Basic ROI Formula
The standard ROI formula is a fantastic starting point. It gives you a clear snapshot of a past campaign or investment. But if you want to make smart, forward-thinking decisions, you have to look deeper.
Relying only on basic ROI is like driving while only looking in the rearview mirror. It tells you where you've been, not where you're going. The real magic happens when you start building long-term customer relationships, and that requires moving past the single-transaction mindset.
Let’s Talk About Customer Lifetime Value (CLV)
One of the most powerful metrics in any e-commerce arsenal is Customer Lifetime Value, or CLV. It completely reframes how you look at your numbers. Instead of asking, "How much did I make from this one sale?" CLV asks, "How much profit can I expect from this customer over their entire relationship with my brand?"
This shift in perspective is a total game-changer. Here’s why:
- It justifies spending more to get the right customer. You might balk at spending $50 to acquire a customer who makes a single $70 purchase. But what if your data shows that customer is likely to spend $500 with you over the next two years? That $50 investment suddenly looks like a brilliant move.
- It proves the real value of customer retention. CLV brings the old saying to life: keeping an existing customer happy is almost always more profitable than constantly chasing new ones.
- It helps you focus your marketing. When you know your CLV, you can zero in on your most valuable customer segments. This lets you tailor your marketing messages and spend your budget where it will have the biggest impact.
Don't Forget the Timing of Your Returns
Another blind spot of the basic ROI formula is that it treats all returns the same, no matter when you get them. A 150% ROI is always great, but does it matter if it takes three years to get it versus three months? You bet it does.
The timing of your return is absolutely critical, especially for a growing business where cash flow is king.
Think about it like investing in the stock market. Historical returns can vary wildly from year to year. For example, the S&P 500 returned just 1.33% in 1994 but a whopping 37.20% the very next year in 1995. The timeline is everything when you're evaluating performance, and the same is true for your business.
ROAS and Other Key Metrics to Watch
When you start running paid ads, you’ll constantly hear the term Return on Ad Spend (ROAS). This is a much more focused metric. It specifically measures the gross revenue you generate for every single dollar you spend on advertising.
It’s a quick-and-dirty way to see if an ad campaign is working on a surface level.
While ROI gives you the bigger picture of overall profitability (since it includes all your costs), ROAS is your go-to for making fast decisions on ad campaigns. If a campaign has a killer ROAS, you can feel confident turning up the budget.
To really get the most out of your data, you need to see ROI as part of a larger dashboard. When you look at it alongside other metrics, you get a much more holistic view of your business's health. It’s all part of choosing the right KPIs for your business.
By looking beyond the basic formula, you stop just measuring past sales and start measuring what actually drives sustainable, long-term growth.
Turning Your ROI Numbers into Action

Alright, you’ve put in the effort and crunched the numbers. You have your ROI. Now what? A number just sitting in a spreadsheet isn't going to grow your business. The real magic happens when you use that data to make smarter, more confident decisions.
This is the moment where calculation turns into real-world growth. It's all about looking at the story your numbers are telling and acting on it. Because without context, an ROI figure is just a number. First things first, you need to figure out what "good" actually looks like for your business.
What Is a Good ROI Anyway?
Honestly, there's no single magic number. A "good" ROI is completely relative and hinges on your industry, profit margins, and the specific investment you're measuring. It's a classic mistake to get hung up on generic benchmarks that don't apply to your situation.
You'll often hear a 5:1 ratio (or 400% ROI) thrown around as a solid standard for marketing—making five dollars for every dollar you spend. But even that can be misleading because it varies so much by channel:
- Email Marketing: This is often the champion, sometimes hitting an eye-watering 36:1 ratio.
- Content Marketing: This is the long game. It builds value over months or even years, so its immediate ROI might look modest.
- Paid Ads (PPC): You'll see results much faster here, but the ROI is typically more direct and sometimes lower than other channels.
The most important benchmark is your own past performance. The real goal isn't just to chase an arbitrary industry average; it's to consistently do better than you did last time.
This isn't just a marketing concept, either. ROI is used to gauge the value of all sorts of long-term investments. For instance, some studies have calculated the average lifetime ROI for a bachelor's degree to be around 681.95%. It’s a powerful metric for evaluating value in completely different contexts. For a deeper dive, the Institute for Learning Innovation has some great insights on this.
A Framework for Smart Decisions
Once you have your ROI figures, you can start making moves. I find it helpful to sort every initiative into one of three simple buckets. This framework gives you a clear path for allocating your two most valuable resources: time and money.
1. Double Down
These are your rockstars—the campaigns and projects with an amazing ROI. The question here isn't if you should invest more, but how. Can you scale the budget? Can you expand the audience? Find ways to pour more fuel on this fire.
2. Optimize or Maintain
Here you’ll find the initiatives that are delivering a positive ROI, but it’s not blowing you away. They’re working, but you know they could be better. The plan here is to get your hands dirty: dig into the analytics, find the weak spots, and start testing new approaches to squeeze more performance out of them.
3. Cut or Re-evaluate
This bucket is for everything with a negative or barely-there ROI. It's time to be unsentimental. Unless there's a compelling strategic reason to keep it going (like a long-term brand play), you need to cut your losses. Pull the plug and immediately redirect that budget to your winners in the "Double Down" category.
Navigating the Tricky Parts of ROI
Alright, so you’ve got the formula down. But as soon as you try to apply it to your actual business, things get... messy. That's totally normal. Real-world ROI isn't always as clean as a simple equation.
Let's dive into some of the most common questions that pop up and get you the clarity you need to move forward. Getting these details right is what separates a fuzzy guess from a number you can actually build a strategy around.
What Do I Do With "Soft" Returns?
This is a classic. How do you measure the ROI of something like brand awareness or a boost in social media engagement? It’s a great question because these things don't come with an immediate price tag.
The trick is to connect these "soft" metrics to a real business outcome, even if it's an indirect connection. For example, did that high-engagement Instagram campaign also lead to a spike in people searching for your brand name on Google? Did that then lead to more sales?
You're essentially building a chain of evidence. You might not plug "brand awareness" directly into your ROI formula, but you can analyze it as a crucial piece of the bigger picture.
It's easy to get stuck trying to assign a perfect dollar value to everything. Don't. Instead, track these softer metrics alongside your financial returns. A campaign with a modest direct ROI that also doubled your email list is a massive long-term win.
How Long Should I Wait Before Measuring ROI?
Patience is a virtue, especially in marketing. The "right" amount of time to wait before calculating ROI really depends on what you’re measuring.
- Content & SEO: This is the long game. You’re often looking at 6-12 months before you can expect to see a real financial return. Measuring ROI after just one month will be incredibly discouraging and flat-out wrong.
- A New Product Launch: You’ll want a bigger dataset than just the first few days. I'd recommend looking at the sales over the entire first quarter to get a true feel for its market performance.
- Paid Ad Campaigns: With platforms like Meta or Google, you can usually get a good read on performance within a few weeks. That gives the algorithms enough time to learn and optimize.
The key is to define these timeframes before you start. It stops you from prematurely killing a great strategy simply because it didn’t deliver instant results.
What if I Can't Pin a Sale on Just One Thing?
Welcome to the club! This is the reality of how people buy things today. A customer might see your ad on TikTok, click a link in your email newsletter a week later, and then finally buy after searching for your brand on Google. Who gets the credit?
This is where attribution models save the day. Instead of giving 100% of the credit to the very last click, a good attribution model helps you spread the credit across the different touchpoints that influenced the sale.
Here are a few common ways to look at it:
- Linear: Every touchpoint gets an equal slice of the credit.
- Time-Decay: The touchpoints closest to the sale get the most credit.
- Position-Based: The first and last touchpoints get the biggest share of credit, with the rest split among the middle interactions.
Most good analytics platforms, like Google Analytics, let you play around with these models. Experimenting with them will give you a much richer understanding of how all your channels work together, preventing you from cutting the budget on a channel that's actually doing a great job introducing new customers to your brand.
At Wand Websites, we don’t just build beautiful websites—we build growth engines. We help businesses break free from platforms like Etsy and create powerful Shopify stores designed to increase traffic, boost conversions, and build a brand you own. Ready to see what your business is truly capable of? Learn how we can transform your e-commerce presence.
