Top 10 Ecommerce Metrics to Track for Growth in 2025

Running a successful e-commerce store is about more than just watching sales numbers climb. True, sustainable growth comes from understanding the why behind the what. Are your marketing dollars actually working? Are your customers happy enough to come back? Answering these questions requires looking beyond surface-level data and digging into the specific ecommerce metrics to track for a clear picture of your business health. This isn't just about collecting data; it's about turning numbers into actionable strategies that drive real results.
This guide unpacks the 10 most critical metrics that separate thriving stores from those that stall out. We'll go beyond simple definitions, showing you exactly how to calculate each one, what good benchmarks look like, and how to use these insights to make smarter decisions that fuel long-term success. You'll learn how to diagnose problems, from a leaky checkout process to inefficient ad spend, and discover opportunities to increase profitability.
Think of this as your data-driven roadmap to not just selling more, but building a stronger, more resilient business. We’ll cover everything from Customer Lifetime Value (CLV) and Return on Ad Spend (ROAS) to often-overlooked indicators like Net Promoter Score (NPS), giving you a complete toolkit for scalable growth.
1. Conversion Rate
If you only track one thing, make it your conversion rate. This is the ultimate bottom-line metric that tells you what percentage of your website visitors are turning into paying customers. It’s the clearest indicator of how well your product pages, checkout process, and overall user experience are working together to drive sales. Without a solid conversion rate, even a flood of traffic won't translate into meaningful revenue.
How It Works
Calculating your conversion rate is straightforward. Simply divide the number of orders by the total number of unique website visitors over a specific period, then multiply by 100 to get a percentage.
- Formula: (Number of Conversions / Total Visitors) * 100 = Conversion Rate (%)
For example, if you had 50 sales from 2,500 visitors last month, your conversion rate would be 2%. This simple calculation is one of the most powerful ecommerce metrics to track for gauging performance.
Actionable Tips for Improvement
Pro-Tip: Don't just track your overall conversion rate. Segment it by traffic source (e.g., Google, Instagram, email) to see which channels bring in the most valuable, ready-to-buy customers.
- A/B Test Everything: Test variations of your product descriptions, call-to-action buttons, images, and even page layouts to find what resonates most with your audience.
- Optimize for Mobile: A clunky mobile checkout is a conversion killer. Ensure your site is fast, responsive, and easy to navigate on a smartphone.
- Track Micro-Conversions: Monitor smaller actions like email signups or "add to cart" clicks. These are strong indicators of purchase intent and can highlight friction points before the final sale.
The bar chart below illustrates typical conversion rate benchmarks across different ecommerce tiers.
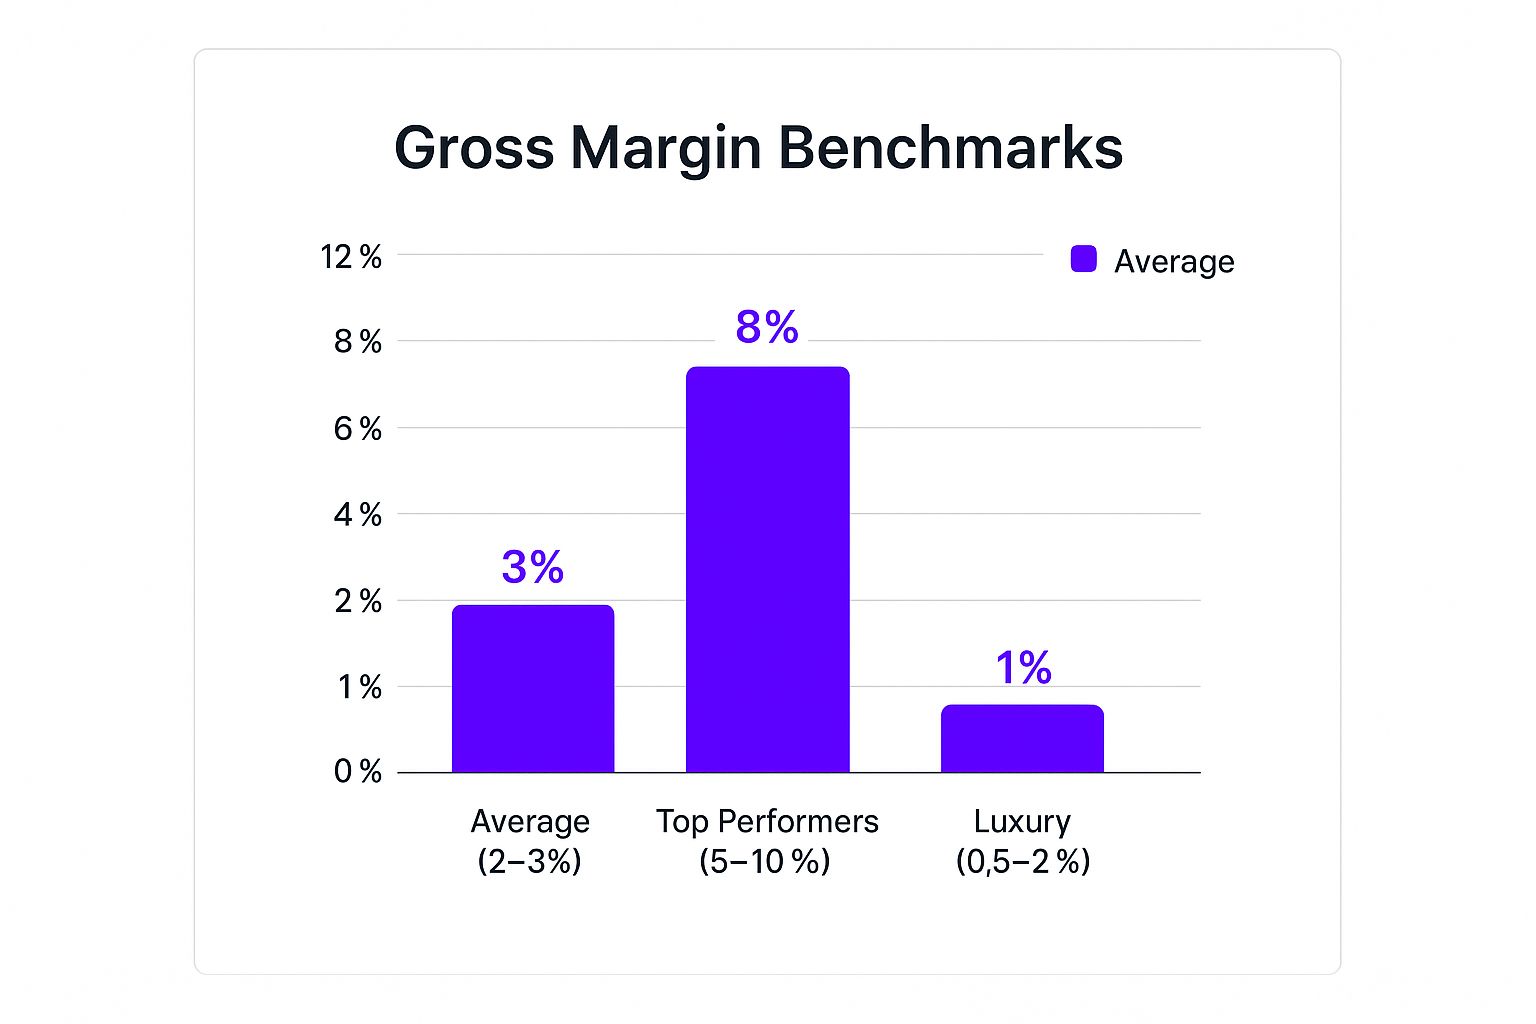
As the chart shows, a "good" conversion rate varies significantly, with top performers achieving over 5%, while luxury brands often see lower rates due to higher price points and longer consideration cycles.
2. Customer Acquisition Cost (CAC)
If conversion rate is your bottom-line sales metric, Customer Acquisition Cost (CAC) is its financial counterpart. This metric reveals exactly how much you spend, on average, to gain a single new customer. Knowing your CAC is non-negotiable for sustainable growth; without it, you could be spending more to acquire customers than they're actually worth, leading your business down an unprofitable path even with rising sales.

How It Works
Calculating CAC involves adding up all your marketing and sales expenses over a set period and dividing that total by the number of new customers you acquired in that same timeframe. Be thorough here; include ad spend, salaries of your marketing team, software subscriptions, and any related overhead.
- Formula: (Total Marketing & Sales Costs / Number of New Customers Acquired) = CAC
For instance, if you spent $5,000 on marketing last quarter and acquired 250 new customers, your CAC would be $20. This figure is one of the most critical ecommerce metrics to track for ensuring your marketing budget is working efficiently.
Actionable Tips for Improvement
Pro-Tip: Don't just calculate a "blended" CAC. Track it by channel (e.g., Facebook Ads, Google Ads, influencer marketing) to discover which sources deliver customers most cost-effectively, allowing you to reallocate your budget for maximum impact.
- Focus on High-Value Channels: Once you identify your most efficient acquisition channels, double down on what’s working. If an influencer campaign has a $15 CAC while Google Ads has a $40 CAC, you know where to invest more.
- Optimize Your Funnel: Improve your conversion rate at every step. A smoother user experience means more visitors convert, which lowers your CAC without increasing ad spend.
- Boost Customer Lifetime Value (LTV): A high CAC can be sustainable if customers make repeat purchases. Implement retention strategies like email marketing and loyalty programs to increase the LTV:CAC ratio. To gain further insights into optimizing your marketing spend and truly understand your customer acquisition efforts, explore strategies on how to lower your Cost Per Acquisition.
3. Customer Lifetime Value (CLV/LTV)
While conversion rate focuses on the first purchase, Customer Lifetime Value (CLV or LTV) measures the total revenue you can expect from a single customer over their entire relationship with your brand. It shifts the focus from a one-time transaction to long-term profitability. Tracking CLV is crucial because it tells you exactly how much you can afford to spend to acquire a new customer and what your most valuable customer segments look like.
How It Works
A simple way to calculate CLV is to multiply a customer's average order value by their average purchase frequency and then by their average customer lifespan. This gives you a powerful forecast of future revenue.
- Formula: (Average Order Value x Average Purchase Frequency) x Average Customer Lifespan = CLV
For instance, if your average customer spends $50 per order, buys 3 times a year, and stays with you for 2 years, their CLV is $300. This is one of the most insightful ecommerce metrics to track for sustainable growth.
Actionable Tips for Improvement
Pro-Tip: Your CLV to Customer Acquisition Cost (CAC) ratio is the ultimate health check for your marketing spend. A healthy business should aim for a ratio of at least 3:1, meaning each customer generates at least three times the revenue as it cost to acquire them.
- Segment by CLV: Identify your high-value customers and create VIP loyalty programs, exclusive offers, or personalized communications to keep them engaged and purchasing.
- Focus on Retention: Implement post-purchase email flows that encourage repeat business. Offer complementary product recommendations or a small discount on their next order.
- Use Cohort Analysis: Group customers by when they made their first purchase (e.g., "January 2024 Cohort"). Tracking the CLV of different cohorts over time reveals how changes to your marketing or products impact long-term customer value.
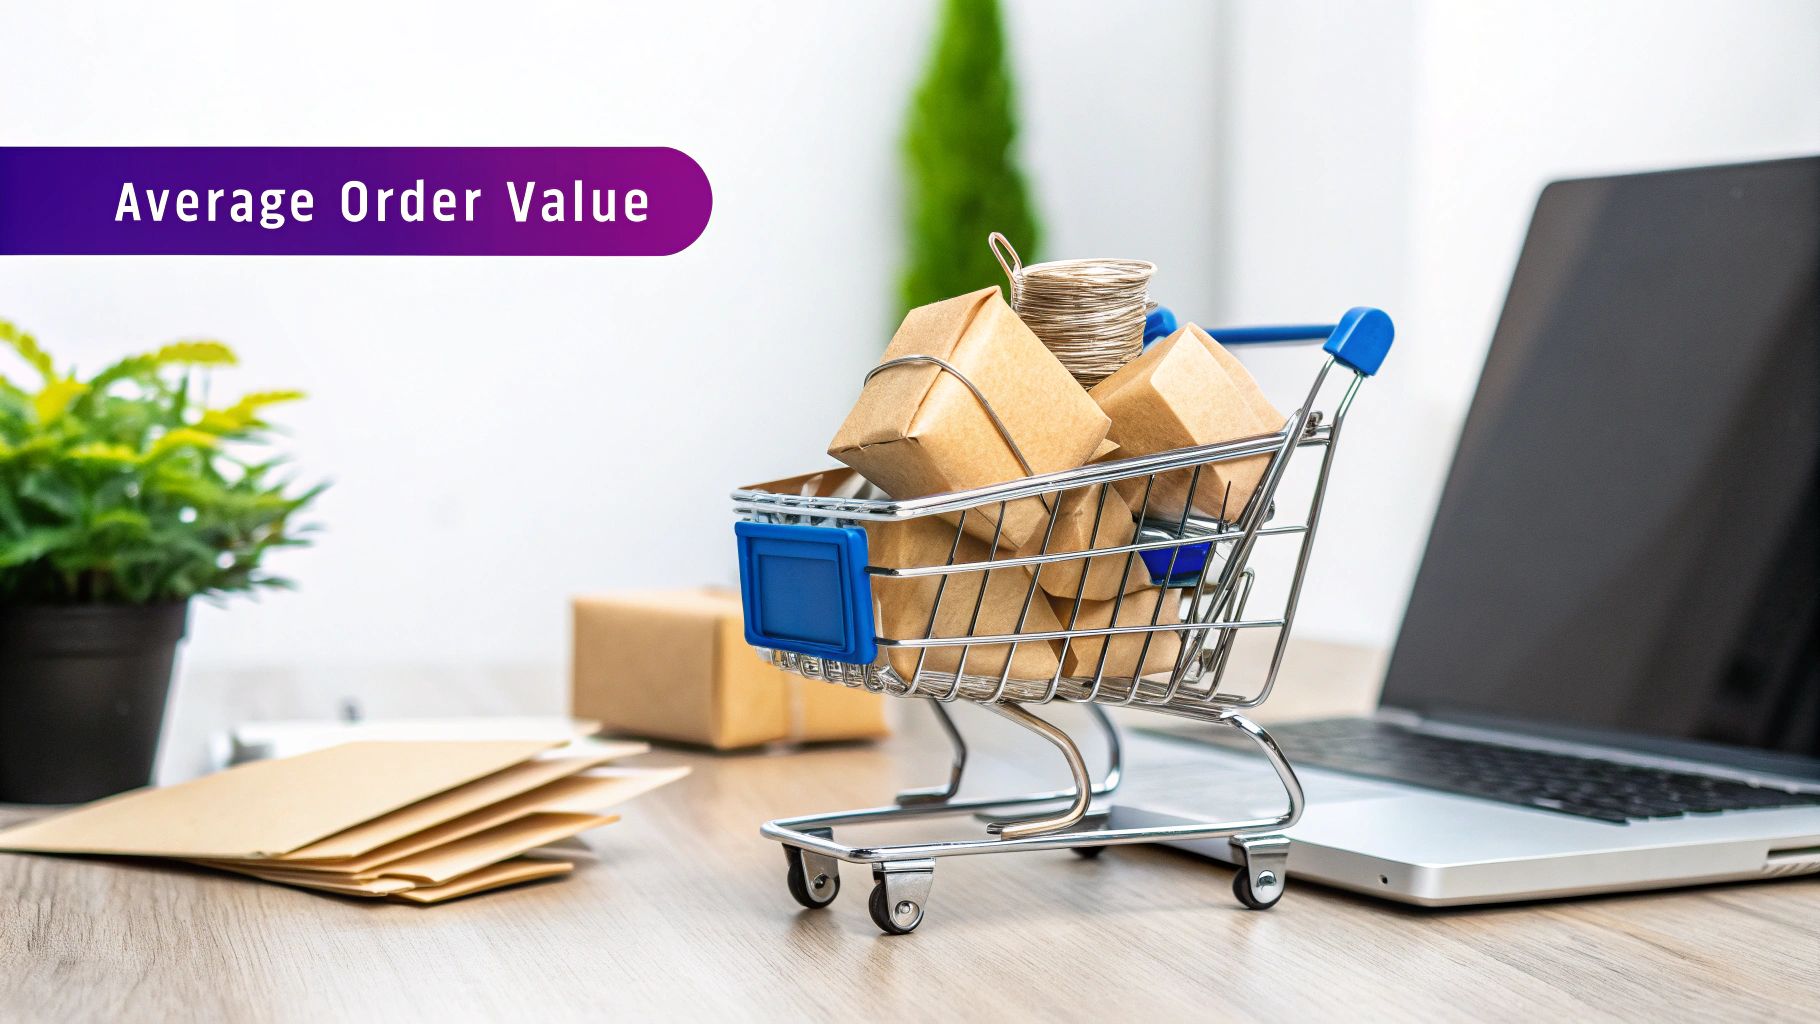
4. Average Order Value (AOV)
While conversion rate focuses on turning visitors into customers, Average Order Value (AOV) tells you how much each of those customers is spending per transaction. Boosting your AOV is one of the most efficient ways to increase revenue without needing more traffic. It's a key metric for understanding customer purchasing habits and maximizing the value of every single sale.
How It Works
Calculating your AOV is simple. You just divide your total revenue by the total number of orders placed during the same time period. This gives you the average dollar amount spent on each purchase, making it a powerful ecommerce metric to track for profitability.
- Formula: Total Revenue / Number of Orders = Average Order Value ($)
For example, if your store generated $10,000 in revenue from 200 separate orders last month, your AOV would be $50. This figure helps you set benchmarks for growth and measure the success of your upselling and cross-selling efforts.
Actionable Tips for Improvement
Pro-Tip: Set a free shipping threshold that is slightly higher than your current AOV. If your AOV is $50, offering free shipping on orders over $65 encourages customers to add one more item to their cart.
- Create Product Bundles: Group related products together and offer them at a slight discount compared to buying them individually. This increases the perceived value and lifts the total cart size.
- Implement Upsells and Cross-sells: Suggest complementary items (cross-sells) or premium versions (upsells) during the checkout process. Amazon’s recommendation engine is a prime example, driving a significant portion of its sales.
- Offer Tiered Discounts: Use promotions like "Spend $100, get 15% off" to motivate customers to spend more to reach a higher discount tier.
5. Cart Abandonment Rate
The cart abandonment rate is one of the most crucial ecommerce metrics to track because it represents pure, recoverable revenue. This metric highlights the percentage of shoppers who add items to their cart but leave your site before completing the purchase. A high rate often signals a significant friction point in your checkout process, from unexpected shipping costs to a complicated form. Tackling this metric head-on can provide one of the quickest lifts to your bottom line.
How It Works
This calculation shows you the proportion of incomplete purchases compared to initiated ones. You can find this data in your ecommerce platform’s analytics, such as Shopify or BigCommerce, or within Google Analytics.
- Formula: 1 - (Completed Purchases / Shopping Carts Created) * 100 = Cart Abandonment Rate (%)
For instance, if 1,000 carts were created and only 300 resulted in a completed sale, your cart abandonment rate would be 70%. This tells you that 7 out of 10 potential customers are dropping off at the final hurdle.
Actionable Tips for Improvement
Pro-Tip: Don't assume all abandoned carts are lost forever. Many shoppers use the cart as a "wishlist" and fully intend to return. A well-timed reminder email or retargeting ad can be the gentle nudge they need to finish checking out.
- Implement Cart Abandonment Emails: Set up an automated email sequence to remind shoppers about the items they left behind. Offering a small discount in the second or third email can be highly effective.
- Simplify Your Checkout: Reduce the number of form fields and steps required to complete a purchase. Brands like ASOS famously cut their abandonment rate by 50% just by streamlining their checkout.
- Offer Guest Checkout: Forcing users to create an account is a major point of friction. Providing a guest checkout option removes this barrier and speeds up the process for new customers.
- Display Trust Signals: Prominently feature security badges (like SSL certificates), accepted payment logos, and clear return policies to build confidence and reassure shoppers their information is safe.
This video provides a great visual breakdown of why shoppers abandon carts and how to win them back.
By actively monitoring and addressing the reasons behind cart abandonment, you can plug a significant leak in your sales funnel and convert high-intent visitors into loyal customers.
6. Return on Ad Spend (ROAS)
While traffic is great, profitable traffic is what scales an ecommerce business. Return on Ad Spend (ROAS) is a critical marketing metric that tells you exactly how much revenue you're generating for every dollar you spend on advertising. It cuts through vanity metrics to reveal the true financial performance of your campaigns, making it essential for smart budget allocation and sustainable growth. If you're spending money to acquire customers, ROAS is a non-negotiable metric to track.
How It Works
Calculating ROAS is a direct measure of your advertising efficiency. You divide the total revenue generated from a specific ad campaign by the total cost of that campaign. A result of 4:1, for example, means you earned $4 for every $1 you spent.
- Formula: (Revenue from Ad Campaign / Cost of Ad Campaign) = ROAS Ratio
For instance, if your Google Ads campaign cost $1,000 and generated $5,000 in sales, your ROAS would be 5:1. This powerful calculation is one of the most important ecommerce metrics to track to ensure your marketing budget is an investment, not an expense.
Actionable Tips for Improvement
Pro-Tip: Don't just aim for a high ROAS; aim for a profitable one. Factor in your product's profit margins to set a minimum ROAS target. A 3:1 ROAS might be fantastic for a high-margin product but unsustainable for a low-margin one.
- Segment by Campaign and Channel: Analyze ROAS for each platform (Google, Facebook, TikTok) and individual campaign. This reveals which channels deliver profitable customers, allowing you to double down on what works and cut what doesn't.
- Track Different Attribution Windows: A customer might see an ad today but buy next week. Analyze ROAS across various attribution windows (e.g., 7-day click, 28-day view) to get a more accurate picture of campaign influence over time.
- Incorporate Customer Lifetime Value (LTV): A low initial ROAS might be acceptable if the campaign acquires customers with a high LTV. Consider a blended ROAS that accounts for a customer's total future value, not just their first purchase.
7. Customer Retention Rate
While acquiring new customers is exciting, retaining your existing ones is where long-term profitability is built. Customer Retention Rate (CRR) measures the percentage of customers who continue to buy from you over a specific period. It’s a vital sign of brand loyalty, product satisfaction, and the overall health of your business model. High retention means you’re creating real value that keeps people coming back for more.
How It Works
To calculate CRR, you need three numbers over a set period (like a quarter or a year): the number of customers at the start, the number at the end, and the number of new customers acquired during that time.
- Formula: [ (Customers at End - New Customers) / Customers at Start ] * 100 = Customer Retention Rate (%)
For instance, if you started the year with 1,000 customers, ended with 1,200, and acquired 300 new customers, your retention rate would be 90%. Tracking this is one of the most important ecommerce metrics for sustainable growth.
Actionable Tips for Improvement
Pro-Tip: Don’t just look at who stayed; analyze who left. Use exit surveys or reach out to churned customers to understand their reasons for leaving. This feedback is gold for preventing future churn.
- Launch a Loyalty Program: Reward repeat customers with points, exclusive discounts, or early access to new products. This creates a powerful incentive to shop with you again.
- Perfect Your Post-Purchase Experience: A great onboarding or unboxing experience can delight new customers and set the stage for their second purchase. Follow up with helpful content or check-in emails.
- Personalize Communication: Use customer data to send relevant product recommendations, birthday offers, and personalized content. This shows you understand their needs and value their business.
8. Revenue Per Visitor (RPV)
While conversion rate tells you how many visitors buy and AOV tells you how much they spend, Revenue Per Visitor (RPV) combines these two powerful ecommerce metrics to track into one. RPV reveals the average amount of money generated by every single person who lands on your site, regardless of whether they make a purchase. This provides a holistic view of your site’s ability to monetize traffic and highlights the overall health of your sales funnel.
How It Works
Calculating your RPV is simple. You just divide your total revenue over a specific period by the total number of unique visitors during that same timeframe. This gives you a single, powerful dollar value that represents each visitor's worth.
- Formula: Total Revenue / Total Unique Visitors = Revenue Per Visitor ($)
For example, if your store generated $10,000 in revenue from 4,000 visitors last month, your RPV would be $2.50. This means every visitor, on average, contributed $2.50 to your top line.
Actionable Tips for Improvement
Pro-Tip: RPV is the ultimate metric for evaluating the performance of marketing campaigns. A campaign might drive tons of cheap traffic, but if the RPV is low, it’s not delivering quality, ready-to-buy customers.
- Focus on AOV and Conversion Rate Simultaneously: Since RPV is a direct product of these two metrics, improving them is the best way to boost it. Implement product bundling, upselling, and cross-selling strategies while also optimizing your checkout flow.
- Segment RPV by Traffic Source: Analyze which channels (e.g., Google Ads, organic search, social media) deliver the highest RPV. This allows you to double down on your most profitable channels and optimize your marketing spend for maximum return.
- Evaluate Landing Page Performance: Use RPV to measure how effectively different landing pages convert traffic into revenue. A page with high traffic but low RPV might need design or copy adjustments to better guide visitors toward a purchase.
9. Email Marketing ROI
In the world of digital marketing, few channels offer the direct connection and incredible return of email. Email Marketing ROI measures the profitability of your email campaigns, showing you exactly how much revenue you generate for every dollar spent. It consistently delivers one of the highest ROIs, making it an indispensable tool for nurturing leads and driving repeat purchases. Tracking this metric is crucial for justifying marketing spend and scaling your efforts effectively.
How It Works
Calculating Email Marketing ROI reveals the financial effectiveness of your strategy. You subtract your campaign costs from the revenue generated directly from email, then divide that by the costs and multiply by 100 to get a percentage. Costs include your email service provider (ESP) subscription and any resources for design or copywriting.
- Formula: ((Revenue from Email - Email Campaign Costs) / Email Campaign Costs) * 100 = Email Marketing ROI (%)
For instance, if your email campaigns generated $5,000 in sales last month and your ESP and content creation cost $150, your ROI would be a staggering 3,233%. This kind of return makes it one of the most powerful ecommerce metrics to track.
Actionable Tips for Improvement
Pro-Tip: Don't just send generic newsletters. Use customer purchase history and browsing behavior to create highly targeted segments. Sending a special offer for a product category a customer recently viewed is far more effective than a store-wide blast.
- Automate Your Funnels: Implement automated welcome series for new subscribers and abandoned cart recovery emails. These triggered campaigns work around the clock to convert interested shoppers.
- A/B Test Everything: Continuously test your subject lines, send times, calls-to-action, and email content to discover what drives the highest engagement and sales from your specific audience.
- Optimize for Mobile: The majority of emails are opened on mobile devices. Ensure your emails are designed with a mobile-first approach, featuring a single-column layout, large fonts, and easily tappable buttons.
10. Net Promoter Score (NPS)
While sales metrics tell you what customers are doing, Net Promoter Score (NPS) tells you what they are feeling. It’s a powerful customer loyalty metric that gauges how likely your customers are to recommend your brand to others. A high NPS is a strong signal of brand health, customer satisfaction, and potential for organic, word-of-mouth growth, making it one of the most vital ecommerce metrics to track for long-term success.
How It Works
NPS is measured through a single-question survey: "On a scale of 0-10, how likely are you to recommend our company/product/service to a friend or colleague?" Based on their response, customers are categorized as Promoters (9-10), Passives (7-8), or Detractors (0-6). The final score is calculated by subtracting the percentage of Detractors from the percentage of Promoters.
- Formula: (% of Promoters) - (% of Detractors) = NPS
For example, if 60% of respondents are Promoters and 15% are Detractors, your NPS is 45. Brands like Apple and Amazon are famous for leveraging exceptional service to achieve consistently high scores.
Actionable Tips for Improvement
Pro-Tip: Don’t just look at the final score. The real gold is in the qualitative feedback that follows. Always ask "Why?" to understand the reasoning behind a customer's score and uncover specific areas for improvement.
- Close the Loop: Personally follow up with Detractors to resolve their issues and show you care. This can turn a negative experience into a positive one and prevent churn.
- Segment Your Score: Analyze NPS by customer type, purchase history, or product line. This can reveal if a specific product is causing issues or if your most valuable customers are happy.
- Track Trends Over Time: A single NPS score is just a snapshot. Monitor your score quarterly or biannually to understand if your customer-centric initiatives are actually improving loyalty.
Key Metric Comparison for Top 10 Ecommerce KPIs
From Data to Decisions: Your Next Steps
You've just navigated a comprehensive list of the most critical ecommerce metrics to track. From Conversion Rate to Customer Lifetime Value, and from ROAS to NPS, each number tells a unique part of your brand's story. But remember, data on its own is just noise. The real power comes from transforming these numbers into a clear, actionable strategy that fuels sustainable growth.
The sheer volume of data available can feel overwhelming, especially if you're managing a growing store doing $20k-$60k a month or moving from a platform like Etsy to your own dedicated site. The key is to avoid "analysis paralysis" by starting small and staying focused. Don't try to optimize all ten metrics at once. Instead, choose your "North Star" metrics for this quarter.
Creating Your Action Plan
To make this tangible, let's build a simple, effective starting plan:
- Pick Your "Big Two": Select one metric focused on acquisition and one on profitability. A great starting pair is Customer Acquisition Cost (CAC) and Average Order Value (AOV). Your goal is simple: lower what it costs to get a customer while increasing how much each customer spends.
- Set a Baseline: Before you change anything, document where you stand today. What is your current CAC? What is your AOV? This baseline is your benchmark for all future efforts.
- Brainstorm Initiatives: For AOV, you could test product bundles, implement a free shipping threshold, or add one-click upsells post-purchase. For CAC, you might refine your ad targeting, invest in higher-converting landing pages, or shift budget towards more organic channels like SEO.
- Implement and Track: Launch one or two of these initiatives and give them time to generate data. Monitor your "Big Two" metrics weekly to see the impact of your changes. This cycle of hypothesizing, implementing, and measuring is the engine of e-commerce growth.
Beyond Your Website: Leveraging Platform-Specific Data
As you master the core ecommerce metrics to track on your own site, remember to leverage the data available on other platforms where you sell. If you have a presence on major marketplaces, for example, mastering Amazon Brand Analytics reports can provide a completely different layer of insight into customer search behavior, competitor performance, and market basket analysis. Integrating these external data sources with your internal metrics creates a truly holistic view of your business health.
Ultimately, your journey with data isn't about reaching a final destination; it's about building a system. It’s about creating a culture where every decision, from a new ad campaign to a website redesign, is informed by real numbers, not just gut feelings. This data-driven mindset is what separates stagnant stores from scalable, predictable, and wildly profitable e-commerce brands. You now have the map, the metrics, and the method. It's time to start making decisions that count.
Is your website built to turn this data into dollars? At Wand Websites, we design and build high-converting Shopify stores that make tracking these metrics and implementing improvements seamless. If you’re ready to stop guessing and start growing with a website optimized for performance, let's talk.
